Cash Flow Cash flow is the sum of money recorded as receipts or disbursements in a project’s financial records. A cash flow diagram presents the flow of cash as arrows on a time line scaled to the magnitude of the cash flow, where expenses are down arrows and receipts are up arrows.
Year-end convention ~ expenses occurring during the year are assumed to occur at the end of the year.
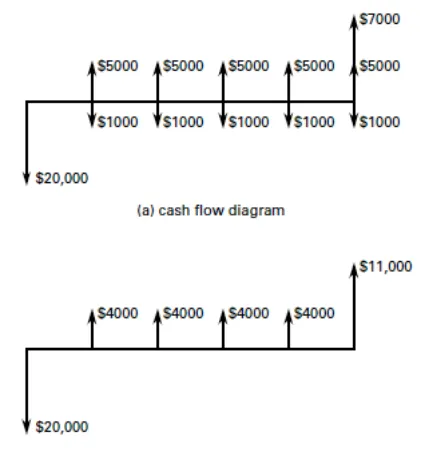
Example (FEIM): A mechanical device will cost $20,000 when purchased. Maintenance will cost $1000 per year. The device will generate revenues of $5000 per year for 5 year. The salvage value is $7000.
Discount Factors and Equivalence Present Worth (P):
· present amount at t = 0 Future Worth (F): equivalent future amount at t = n of any present amount at t = 0 Annual Amount (A):
· uniform amount that repeats at the end of each year for n years Uniform Gradient Amount (G):
· uniform gradient amount that repeats at the end of each year, starting at the end of the second year and stopping at the end of year n