In economic analysis spreadsheets may be helpful for a number of purposes:
· Constructing tables of cash flows
· Using annuity functions to calculate P, F, A, n, or i.
· Using a block function to find the present worth or internal rate of return for a table of cash flows
· Making graphs for analysis and presentations
· Calculating “what-if” for various problem variables.
Spreadsheet annuity functions
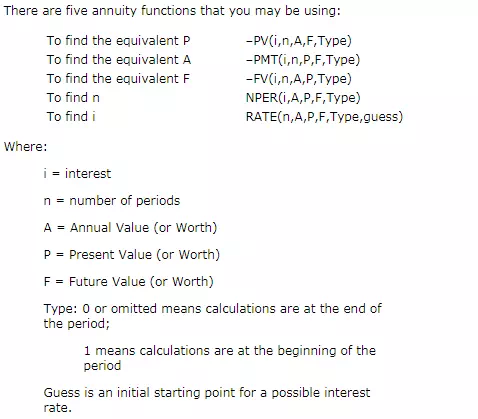
There are five annuity functions that you may be using:
You only enter the values needed to permit the calculation. If you know the interest, number of periods, and the future value, that is sufficient. For example. i=5%, n=10, and F=$20,000.00, you would set it up in the spreadsheet:
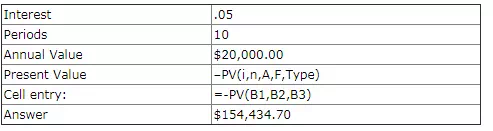
If you copy this table and paste it in an empty spreadsheet, starting in cell A1, B5 will show the answer we have provided in B6. Notice that a minus sign is required to yield a positive answer. This is a convention for these annuity functions. This is true for PV, PMT, and FV, the value is negative for positive parameter values. Also you will see that the interest is represented as a decimal however Excel will allow you to designate a cell to be a “percent” in which case it knows to use the decimal equivalent.
Now look at another function, PMT, which means payment, but is what we refer to as the Annual Value.
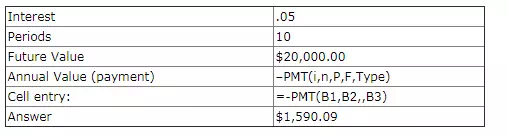
Notice that there are two commas (,,) together. The function expected to see the value for P between the commas, but it is only necessary to provide one of the two parameters P or F. Similarly for PV provide A or F and for FV provide A or P.
Notice that this tells us that at 5% interest, by depositing $1590.09 each year for 10 years we will have $20,000 at the end.
Once you have set up these functions you can try different values. Change the value for interest; what happens?
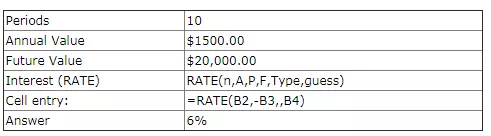
Now consider the RATE function.


Comments are closed.