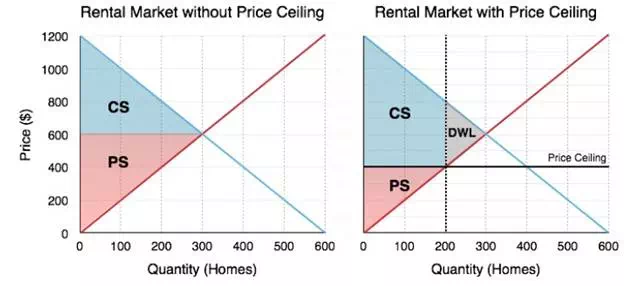
To find out the impact of government’s price ceiling, we must calculate market surplus before, and after a policy. This method will be an important gauge for all our policy analysis in this topic. Consider Figure 4.5b, where the effects of the Price Ceiling is shown.
Before
The calculation of market surplus before policy intervention should be straight forward by now. Market surplus is equal to the sum of consumer surplus and producer surplus, calculating from Figure 4.6b:
Consumer Surplus (Blue Area): [(1200-600) x 300]/2 = $90,000
Producer Surplus (Red Area): [(600) x 300]/2 = $90,000
Market Surplus: $180,000
After
The calculation of market surplus after intervention is less obvious. Consumers have lost surplus in some areas, but gained surplus in others (we will look at this closely in the next Figure 4.5c). Producers have lost surplus.
Consumer Surplus (Blue Area): [(1200-800) x 200]/2] + (400×200) = $120,000
Producer Surplus (Red Area): [(600) x 300]/2 = $40,000
Market Surplus: $160,000
Looking before and after we see that producer surplus has decreased and consumer surplus increased – but the decrease in producer surplus outweighed the effects of the increase in consumer surplus, causing deadweight loss. This means that the market is less efficient, because by removing the regulation, the market as a whole is better off.
What About Redistribution?
It’s easy to look at the total numbers and show that market surplus has decreased, but how does this change affect individual consumers and firms?
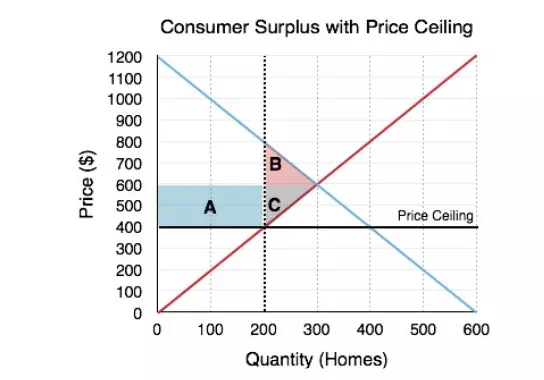
In Figure 4.6d the areas which change as a result of the policy are shown.
Consumers
Consumers gain an area of A and lose an area of B.
Surplus Decrease – Area B
As mentioned previously, the quantity supplied in the market decreases from 300 rental units to 200. This means that 100 renters can no longer find homes. We can assume that the consumers who are willing to pay most for the homes will end up with the rental units (they will start looking earlier, exploring more options etc.) so consumers on the demand curve WTP between $800 and $600 will be cut out of the market. This results in a $10,000 loss in consumer surplus, shown in Figure 4.6d as area B.
Surplus Increase – Area A
Alternatively, the 200 consumers who are able to find homes now go from paying $600/month to paying $400/month, resulting in a $40,000 increase in consumer surplus. This is shown in Figure 4.6d as area A.
Overall, consumers gain $30,000, which is consistent with the calculations above.