Cash flow diagrams are graphical representation of cash flows (inflows and out flows) along a time line. Individual inflows or outflows are designated by vertical lines and relative magnitude can be represented by the heights of lines. Cash inflows are designated by vertical lines above the axis and cash outflows below the time line axis. Inflows take a positive sign whereas outflows take negative sign. Cash flow diagrams involve magnitude and direction fulfilling the properties of flow.
Cash flow transactions are of five types, Viz.
i) Single cash flow
ii) Uniform series
iii) Linear Gradient series
iv) Geometric gradient series
v) Irregular series
Let’s discuss each of the above cash flow transactions. Single payment cash flow: It involves a single present or future cash flow.
The diagram of this is given below.
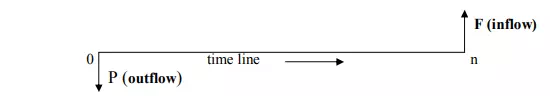
In this diagram there is single cash out flow (P) which occurs at ‘0’ time and Cash inflow of (F), which occurs at nth time. Uniform series:
Here cash flows involve a series of equal amounts occurring at equal interval of time. It is also known as annuity

Linear Gradient series: It is a series of cash flows displaying properties of arithmetic progression series. So the cash flow increases or decreases by a fixed amount.
Time-Value equivalence
Time value equi valence is based on equivalent numerical value not equivalent purchasing power. If two cash flows can produce same effects, then it is said that there is an equivalence existing between these two cash flows. For example, we can say that INR 1000 is equivalent to INR 1210 after two years at a rate of interest 10% per annum.