Demand
Demand is a widely used term, and in common is considered synonymous with terms like ‘want’ or ‘desire’. In economics, demand has a definite meaning which is different from ordinary use. In this chapter, we will explain what demand from the consumer’s point of view is and analyze demand from the firm perspective.
Demand for a commodity in a market depends on the size of the market. Demand for a commodity entails the desire to acquire the product, willingness to pay for it along with the ability to pay for the same.
Law of Demand
The law of demand is one of the vital laws of economic theory. According to the law of demand, other things being equal, if the price of a commodity falls, the quantity demanded will rise and if the price of a commodity rises, its quantity demanded declines. Thus other things being constant, there is an inverse relationship between the price and demand of commodities.
Things which are assumed to be constant are income of consumers, taste and preference, price of related commodities, etc., which may influence the demand. If these factors undergo change, then this law of demand may not hold good.
Definition of Law of Demand
According to Prof. Alfred Marshall “The greater the amount to be sold, the smaller must be the price at which it is offered in order that it may find purchase. Let’s have a look at an illustration to further understand the price and demand relationship assuming all other factors being constant −
| Item | Price (Rs.) | Quantity Demanded (Units) |
| A | 10 | 15 |
| B | 9 | 20 |
| C | 8 | 40 |
| D | 7 | 60 |
| E | 6 | 80 |
In the above demand schedule, we can see when the price of commodity X is 10 per unit, the consumer purchases 15 units of the commodity. Similarly, when the price falls to 9 per unit, the quantity demanded increases to 20 units. Thus quantity demanded by the consumer goes on increasing until the price is lowest i.e. 6 per unit where the demand is 80 units.
The above demand schedule helps in depicting the inverse relationship between the price and quantity demanded. We can also refer the graph below to have more clear understanding of the same −
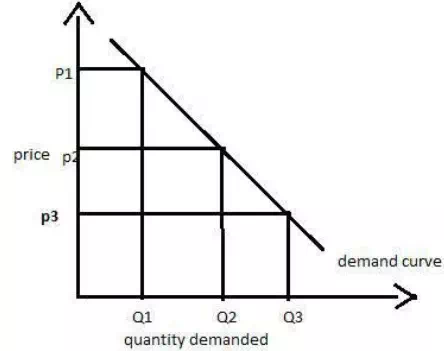
We can see from the above graph, the demand curve is sloping downwards. It can be clearly seen that when the price of the commodity rises from P3 to P2, the quantity demanded comes down Q3 to Q2.


Comments are closed.