Movement and Shift in the Demand Curve
Other things being equal, Demand of a commodity has a negative relationship with the price of the commodity
(Change)Movement in Demand – Movement in demand can be demonstrated as the change in quantity demanded as a result of change in price. Movement is along the same demand curve. When price increases, demand decreases
( Increase/ Decrease)Shift in Demand – changes in other relevant factors other than price cause a shift in demand, that is, a shift of the demand curve to the left or right. Such a shift results in a change in quantity supplied for a given price level. Shift of the demand is called increase or decrease in demand. If the change causes an increase in the quantity demanded at the same price, the demand curve would shift to the right and if the change causes an decrease in the quantity demanded at the same price, the supply curve would shift to the left.
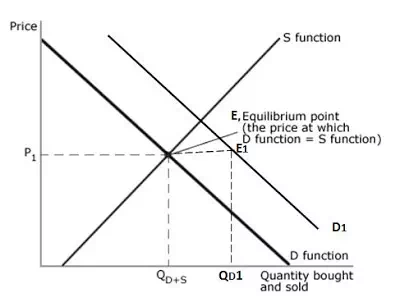
In the above curve,
· D = initial demand curve
· S = initial supply curve
· D1 = new demand curve
· This new demand curve shows increase in demand at the same price.
· It means factors other than price are responsible for an increase in demand.
· Earlier at P1, Q D+S was demanded and now, due to change in factors, QD1 is demanded.
Change in supply and Increase/decrease in quantity supplied
.
Movement and Shift in the Supply Curve
Other things being equal, Supply of a commodity has a positive relationship with the price of the commodity
(Change)Movement in supply – movement in supply can be demonstrated as the change in quantity supplies as a result of change in price. Movement is along the same supply curve.
(Increase/ Decrease)Shift in supply – changes in other relevant factors other than price cause a shift in supply, that is, a shift of the supply curve to the left or right. Such a shift results in a change in quantity supplied for a given price level. If the change causes an increase in the quantity supplied at each price, the supply curve would shift to the right and if the change causes an decrease in the quantity supplied at each price, the supply curve would shift to the left.
Here.
· S = initial supply curve
· D = initial demand curve
· S1 = new supply curve
· This new supply curve shows increase in supply at the same price.
· It means factors other than price are responsible for an increase in supply.
· Earlier at P1, Q D+S was supplied and now, due to change in factors, Qs1 is supplied.


