Demand for Goods and Services Economists use the term demand to refer to the amount of some good or service consumers are willing and able to purchase at each price. Demand is based on needs and wants—a consumer may be able to differentiate between a need and a want, but from an economist’s perspective they are the same thing. Demand is also based on ability to pay. If you cannot pay for it, you have no effective demand. What a buyer pays for a unit of the specific good or service is called price.
The total number of units purchased at that price is called the quantity demanded. A rise in price of a good or service almost always decreases the quantity demanded of that good or service. Conversely, a fall in price will increase the quantity demanded. When the price of a gallon of gasoline goes up, for example, people look for ways to reduce their consumption by combining several errands, commuting by carpool or mass transit, or taking weekend or vacation trips closer to home.
Economists call this inverse relationship between price and quantity demanded the law of demand. The law of demand assumes that all other variables that affect demand (to be explained in the next module) are held constant. An example from the market for gasoline can be shown in the form of a table or a graph. A table that shows the quantity demanded at each price, such as Table 3.1, is called a demand schedule. Price in this case is measured in dollars per gallon of gasoline. The quantity demanded is measured in millions of gallons over some time period (for example, per day or per year) and over some geographic area (like a state or a country). A demand curve shows the relationship between price and quantity demanded on a graph like Figure 3.2, with quantity on the horizontal axis and the price per gallon on the vertical axis. (Note that this is an exception to the normal rule in mathematics that the independent variable (x) goes on the horizontal axis and the dependent variable (y) goes on the vertical. Economics is not math.) The demand schedule shown by Table 3.1 and the demand curve shown by the graph in Figure 3.2 are two ways of describing the same relationship between price and quantity demanded.
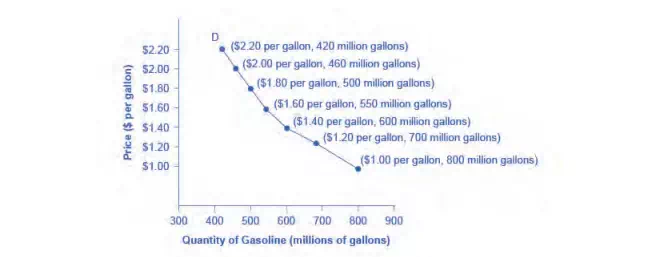

Demand curves will appear somewhat different for each product. They may appear relatively steep or flat, or they may be straight or curved. Nearly all demand curves share the fundamental similarity that they slope down from left to right. So demand curves embody the law of demand: As the price increases, the quantity demanded decreases, and conversely, as the price decreases, the quantity demanded increases.
Supply of Goods and Services
When economists talk about supply, they mean the amount of some good or service a producer is willing to supply at each price. Price is what the producer receives for selling one unit of a good or service. A rise in price almost always leads to an increase in the quantity supplied of that good or service, while a fall in price will decrease the quantity supplied. When the price of gasoline rises, for example, it encourages profit-seeking firms to take several actions: expand exploration for oil reserves; drill for more oil; invest in more pipelines and oil tankers to bring the oil to plants where it can be refined into gasoline; build new oil refineries; purchase additional pipelines and trucks to ship the gasoline to gas stations; and open more gas stations or keep existing gas stations open longer hours. Economists call this positive relationship between price and quantity supplied—that a higher price leads to a higher quantity supplied and a lower price leads to a lower quantity supplied—the law of supply. The law of supply assumes that all other variables that affect supply (to be explained in the next module) are held constant.
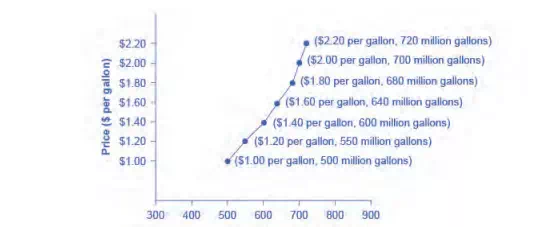
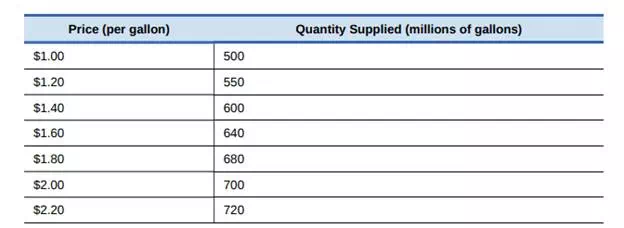
The shape of supply curves will vary somewhat according to the product: steeper, flatter, straighter, or curved. Nearly all supply curves, however, share a basic similarity: they slope up from left to right and illustrate the law of supply: as the price rises, say, from $1.00 per gallon to $2.20 per gallon, the quantity supplied increases from 500 gallons to 720 gallons. Conversely, as the price falls, the quantity supplied decreases.