· In this method, the future worth of various alternatives will be computed. Then, the alternative with the maximum future worth of net revenue or with the minimum future worth of net cost will be selected as the best alternative for implementation.
· Future worth method is used particularly in an investment situation where we need to compute the equivalent worth of the project at the end of its investment period
· For Example: Building a nuclear power plant, where it is time consuming. In such situation it is more common to measure the worth of the investment at the time of commercialization
Revenue-Dominated Cash Flow Diagram
Ø The profit/revenue, salvage value of all inflows to an organization will be assigned with positive sign and the cost outflows will be assigned with negative sign is called revenue dominated cash flow.
Ø A generalized revenue-dominated cash flow diagram to demonstrate the future worth method of comparison is presented in Fig.
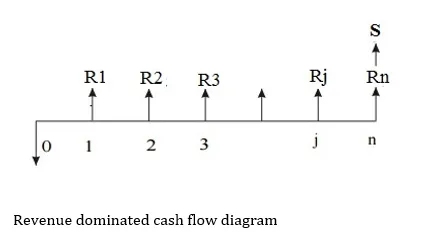
Here,
P = Initial investment
Rj = Revenue at the end of the ‘j’th year
i = Interest rate compounded annually
S = Salvage value at the end of ‘n’th year
The future worth amount of the above revenue dominated cash flow diagram for a given interest rate i is
FW(i) = -P (1 + i)n + R1(1 + i)n-1 + R2 (1 + i) n-2 + … + Rj (1 + i)n-j + Rn + S
The above equation can be simplified as,
FW(i) = -P (F/P, i, n) + R1 (F/P, i, n-1) + R2 (F/P, i, n-2) + . . . + Rj (F/P, i, n-j) + Rn + S
Incase if revenue is equal for all the given years (R1 = R2 = … = Rj = Rn = A) then the above formula is rewritten as,
FW(i) = -P (F/P, i, n) + A (F/A, i, n) + S
The corresponding future worth amount of different alternatives are calculated and compared. The alternative which has maximum future worth amount should be selected as the best alternative.
Cost-Dominated Cash Flow Diagram
The cost outflows of an organization will be assigned with positive sign and the profit/revenue, salvage value of all inflows to an organization will be assigned with negative sign is called cost dominated cash flow.
A generalized cost – dominated cash flow diagram to demonstrate the future worth method of comparison is presented in Fig.
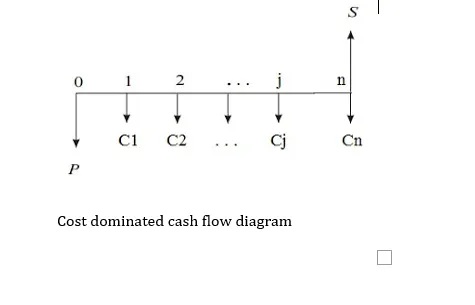
Here,
P = Initial investment
Cj = Revenue at the end of the ‘j’th year
i = Interest rate compounded annually
S = Salvage value at the end of ‘n’th year
The future worth amount of the above cost dominated cash flow diagram for a given interest rate i is
FW(i) = P (1 + i)n + C1(1 + i)n-1 + C2 (1 + i) n-2 + … + Cj (1 + i)n-j + Cn – S
The above equation can be simplified as,
FW(i) = P (F/P, i, n) + C1 (F/P, i, n-1) + C2 (F/P, i, n-2) + . . . + Cj (F/P, i, n-j) + Cn – S
Incase if revenue is equal for all the given years (C1 = C2 = … = Cj = Cn = A) then the above formula is rewritten as,
FW(i) = P (F/P, i, n) + A (F/A, i, n) – S
The corresponding future worth amount of different alternatives are calculated and compared. The alternative which has minimum future worth amount should be selected as the best alternative.


Comments are closed.