In most of the practical decision environments, executives will be forced to select the best alternative from a set of competing alternatives. Let us assume that an organization has a huge sum of money for potential investment and there are three different projects whose initial outlay and annual revenues during their lives are known. The executive has to select the best alternative among these three competing projects.
There are several bases for comparing the worthiness of the projects. These bases are:
1. Present worth method
2. Future worth method
3. Annual equivalent method
4. Rate of return method
ANNUAL EQUIVALENT METHOD
· In the annual equivalent method of comparison, first the annual equivalent cost or the revenue of each alternative will be computed.
· Then the alternative with the maximum annual equivalent revenue in the case of revenue-based comparison or with the minimum annual equivalent cost in the case of cost- based comparison will be selected as the best alternative.
i.Revenue-Dominated Cash Flow Diagram
A generalized revenue-dominated cash flow diagram to demonstrate the annual equivalent method of comparison is presented in Fig.

Fig. Revenue-dominated cash flow diagram.
In Fig. P represents an initial investment, Rj the net revenue at the end of the j th year, and S the salvage value at the end of the nth year.
The first step is to find the net present worth of the cash flow diagram using the following expression for a given interest rate, i:
PW(i) = –P + R1/(1 + i)1 + R2/(1 + i)2 + …
+ Rj/(1 + i) j + … + Rn/(1 + i)n + S/(1 + i)n
In the above formula, the expenditure is assigned with a negative sign and the revenues are assigned with a positive sign.
ii.Cost-Dominated Cash Flow Diagram
A generalized cost-dominated cash flow diagram to demonstrate the annual equivalent method of comparison is illustrated in Fig.
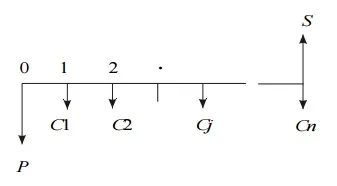
In Fig, P represents an initial investment, Cj the net cost of operation and maintenance at the end of the jth year, and S the salvage value at the end of the nth year.
The first step is to find the net present worth of the cash flow diagram using the following relation for a given interest rate, i.
PW(i) = P + C1/(1 + i)1 + C2/(1 + i)2 + …
+ Cj/(1 + i) j + … + Cn/(1 + i)n – S/(1 + i)n


Comments are closed.