The variation of populations over time, also known as population dynamics, depends on biological and environmental processes that determine population changes. A population’s growth rate is strongly influenced by the proportions of individuals of particular ages. With knowledge of this age structure, population growth can be more accurately predicted. Age structure data allow the rate of growth (or decline) to be associated with a population’s level of economic development.
For example, the population of a country with rapid growth has a triangle-shaped age structure with a greater proportion of younger individuals who are at or close to reproductive age. This pattern typically occurs where fewer people live to old age because of sub-optimal living standards, such as occurs in underdeveloped countries.
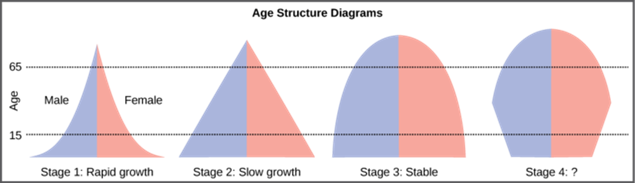
Figure 45.4C.145.4C.1: Population bar graphs for stages of demographic change from expansion to contraction: The leftmost diagram (representing the age structure of a rapidly-growing population) indicates that the number of individuals decreases rapidly with age. The slow-growth model shows that the proportion of individuals decreases steadily with age. The stable population diagram is rounded on top; the older part of the population is a larger proportion of the population than in the other age diagrams. The rightmost diagram represents a population that may be stable or even declining. The relatively few young people may not be making up for the mortality among the older age groups.
Changing Population Age Structure: This 3:28 minute movie discusses age structures and gives examples.
Some developed countries, including the United States, have a slowly-growing population. This results in a column-shaped age structure diagram with steeper sides. In these cases, the population has fewer young and reproductive-aged individuals, with a greater proportion of older individuals. Some developed countries, such as Italy, have zero population growth. Countries with declining populations, such as Japan, have a bulge in the middle of their age structure diagram. The bulge indicates relatively-few young individuals, and a higher proportion of middle-aged and older individuals.
Globally, less-economically developed countries in Africa and Asia have the highest growth rates, leading to populations consisting mostly of younger people. Improved health care, beginning in the 1960s, is one of the leading causes of the increased growth rates that created the population explosion. For example, in the Middle East and North Africa, around 65 percent of the population is under the age of 30. These high growth rates lead to the so-called “youth bulge,” which some experts believe is a cause of social unrest and economic problems such as high unemployment.
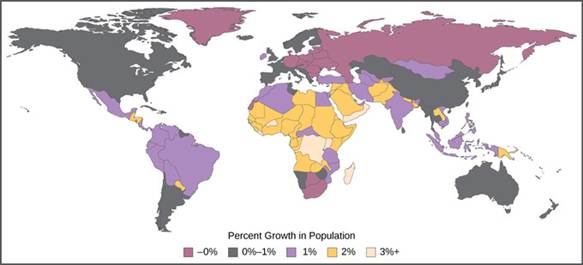
Figure 45.4C.145.4C.1: Global percent growth rate of population: The percent growth rate of population in different countries shows that the highest growth rates are in underdeveloped regions of Africa and Asia.
All of the factors above also have an impact on the average life expectancy. As economic development and quality of health care increase, the life expectancy also increases.
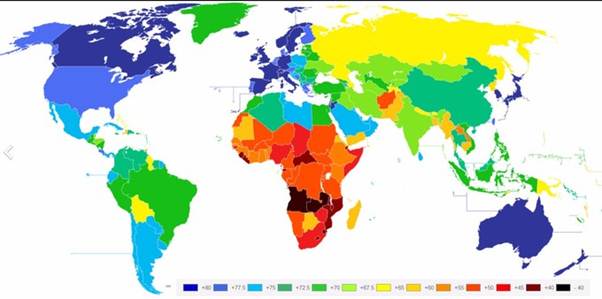
Figure 45.4C: Worldwide Life Expectancy by Country: 2012 map showing average life expectancy by country in years. In 2012, the World Health Organization estimated the average global life expectancy as 70.5 years.


Comments are closed.