Markets for labor have demand and supply curves, just like markets for goods. The law of demand applies in labor markets this way: A higher salary or wage—that is, a higher price in the labor market—leads to a decrease in the quantity of labor demanded by employers, while a lower salary or wage leads to an increase in the quantity of labor demanded. The law of supply functions in labor markets, too: A higher price for labor leads to a higher quantity of labor supplied; a lower price leads to a lower quantity supplied.
Equilibrium in the Labor Market
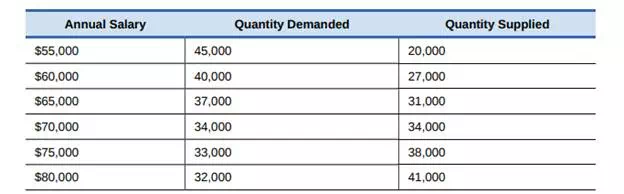
In 2013, about 34,000 registered nurses worked in the Minneapolis-St. Paul-Bloomington, Minnesota-Wisconsin metropolitan area, according to the BLS. They worked for a variety of employers: hospitals, doctors’ offices, schools, health clinics, and nursing homes. Figure 4.2 illustrates how demand and supply determine equilibrium in this labor market. The demand and supply schedules in Table 4.1 list the quantity supplied and quantity demanded of nurses at different salaries.
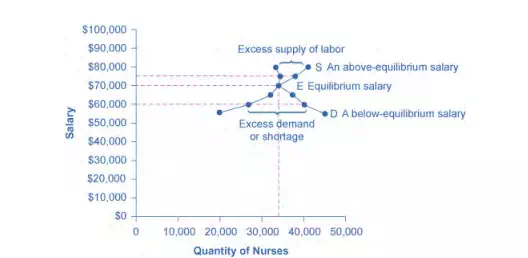
The demand curve (D) of those employers who want to hire nurses intersects with the supply curve (S) of those who are qualified and willing to work as nurses at the equilibrium point (E). The equilibrium salary is $70,000 and the equilibrium quantity is 34,000 nurses. At an above-equilibrium salary of $75,000, quantity supplied increases to 38,000, but the quantity of nurses demanded at the higher pay declines to 33,000. At this above-equilibrium salary, an excess supply or surplus of nurses would exist. At a below-equilibrium salary of $60,000, quantity supplied declines to 27,000, while the quantity demanded at the lower wage increases to 40,000 nurses. At this belowequilibrium salary, excess demand or a surplus exists.
The horizontal axis shows the quantity of nurses hired. In this example, labor is measured by number of workers, but another common way to measure the quantity of labor is by the number of hours worked. The vertical axis shows the price for nurses’ labor—that is, how much they are paid. In the real world, this “price” would be total labor compensation: salary plus benefits. It is not obvious, but benefits are a significant part (as high as 30 percent) of labor compensation. In this example, the price of labor is measured by salary on an annual basis, although in other cases the price of labor could be measured by monthly or weekly pay, or even the wage paid per hour. As the salary for nurses rises, the quantity demanded will fall. Some hospitals and nursing homes may cut back on the number of nurses they hire, or they may lay off some of their existing nurses, rather than pay them higher salaries. Employers who face higher nurses’ salaries may also try to replace some nursing functions by investing in physical equipment, like computer monitoring and diagnostic systems to monitor patients, or by using lower-paid health care aides to reduce the number of nurses they need.
As the salary for nurses rises, the quantity supplied will rise. If nurses’ salaries in Minneapolis-St. Paul-Bloomington are higher than in other cities, more nurses will move to Minneapolis-St. Paul-Bloomington to find jobs, more people will be willing to train as nurses, and those currently trained as nurses will be more likely to pursue nursing as a fulltime job. In other words, there will be more nurses looking for jobs in the area.
Shifts in Labor Demand
The demand curve for labor shows the quantity of labor employers wish to hire at any given salary or wage rate, under the ceteris paribus assumption. A change in the wage or salary will result in a change in the quantity demanded of labor. If the wage rate increases, employers will want to hire fewer employees. The quantity of labor demanded will decrease, and there will be a movement upward along the demand curve. If the wages and salaries decrease, employers are more likely to hire a greater number of workers.
The quantity of labor demanded will increase, resulting in a downward movement along the demand curve. Shifts in the demand curve for labor occur for many reasons. One key reason is that the demand for labor is based on the demand for the good or service that is being produced. For example, the more new automobiles consumers demand, the greater the number of workers automakers will need to hire. Therefore the demand for labor is called a “derived demand.”